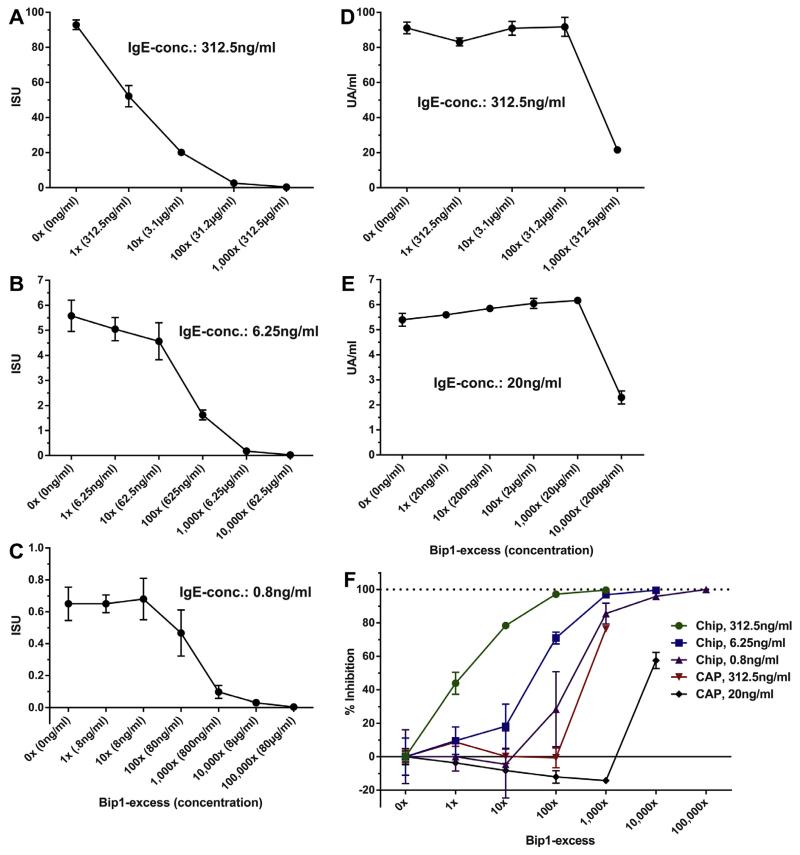
Fig. 4.
Simultaneous presence of blocking IgG reduces detected Bet v 1-specific IgE-levels. Relative excess of Bip1 compared to the respective IgE concentration and (in parenthesis) absolute concentration of Bip1 in ng/ml or μg/ml is shown on the x-axes. Bet v 1-specific IgE-levels detected by the MeDALL allergen-chip (A–C) or by ImmunoCAP (D–E) are displayed on the y-axes in ISU or in UA/ml after subtraction of background signals. IgE-concentrations applied are mentioned in the respective diagrams. Relative inhibition (F) of IgE-signals (y-axis) is plotted against levels of relative Bip1-excess (x-axis). The respective IgE-concentrations applied for detection by MeDALL allergen-chip or ImmunoCAP are displayed in the legend. Mean results of triplicates +/− standard deviations are shown.

