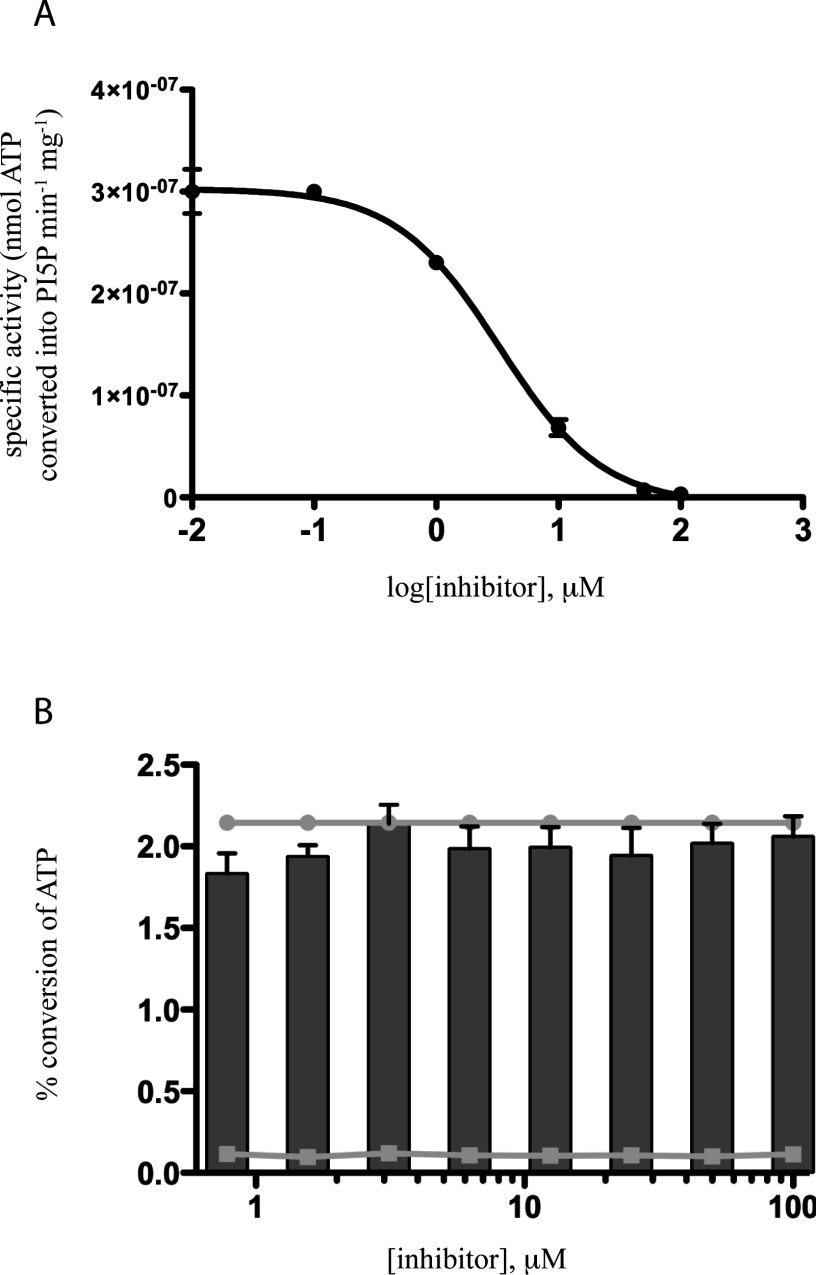
Figure 2. Effect of inhibitor NIH-12848 on PI5P4Kγ activity.
(A) Dose-response curve showing inhibition of PI5P4K activity over a range of inhibitor concentrations (0.01–100 μM). Points represent a mean of five replicates and error bars indicate ± S.E.M. (B) Effect of a range of inhibitor concentrations on intrinsic ATPase activity of PI5P4Kγ. Bars represent percentage ATP conversion by PI5P4Kγ (1 μM) in the presence of NIH-12848, in comparison with the indicated positive control (●; 1μM PI5P4Kγ in the absence of inhibitor). A negative control was also included (□; inhibitor only, no enzyme). n=3, error bars represent ± S.E.M.

