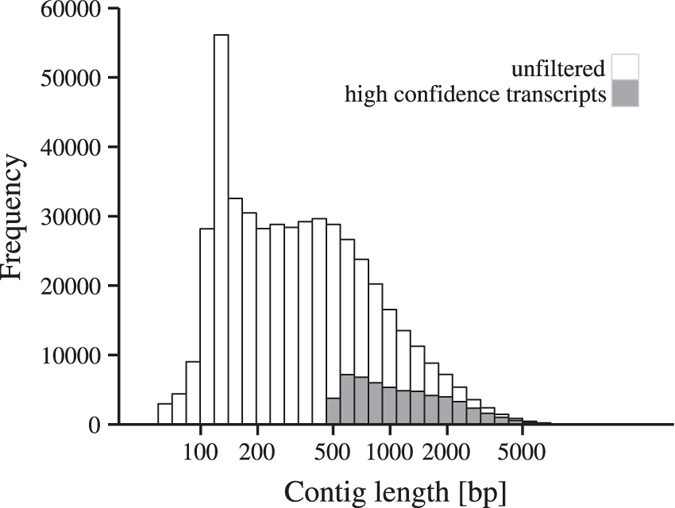
Figure 1. Length distribution of the contigs generated by the Trans-ABySS assembler.

The white distribution shows the contig lengths in the unfiltered assembly and the light grey distribution shows the contig lengths in the filtered assembly.

The white distribution shows the contig lengths in the unfiltered assembly and the light grey distribution shows the contig lengths in the filtered assembly.