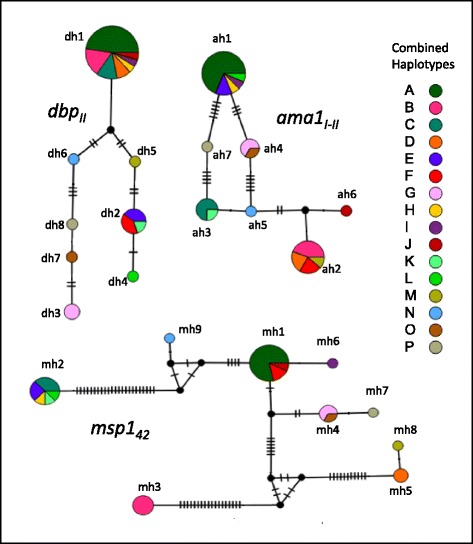
Fig. 2.

Haplotype networks of P. vivax genes encoding merozoite surface proteins in southern Mexico, 2006–2007. The haplotype network for each gene marker is shown. Each circle represents one haplotype and the circle size indicates frequency. The mutational steps are indicated by the short marks crossing the connection lines. Each color indicates a particular combined haplotype (dbp II- ama1 I-II-msp1 4, n = 16; coded by letters A → P). For example, isolates in dark green had the combined haplotype dh1-ah1-mh1, which was highly frequent and only detected in 2007. Meanwhile, isolates in intense pink and orange had a very different configuration (dh1, ah2 and mh3 or mh5), and haplotypes G, N, O and P had a distinctive and unique configuration
