
Fig. 2.
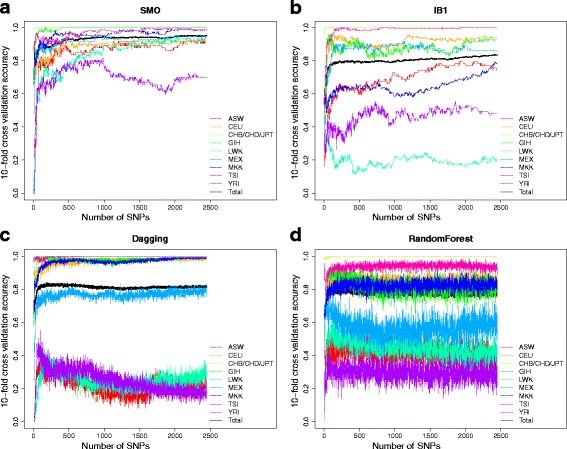
The IFS curves of four different methods. The IFS curves show how the 10-fold cross validation accuracies in each ethnic group (y-axis) change with the number of SNPs (x-axis) using SMO (a), IB1 (b), Dagging (c) and RandomForest (d) methods
Official websites use .gov
A
.gov website belongs to an official
government organization in the United States.
Secure .gov websites use HTTPS
A lock (
) or https:// means you've safely
connected to the .gov website. Share sensitive
information only on official, secure websites.
The IFS curves of four different methods. The IFS curves show how the 10-fold cross validation accuracies in each ethnic group (y-axis) change with the number of SNPs (x-axis) using SMO (a), IB1 (b), Dagging (c) and RandomForest (d) methods