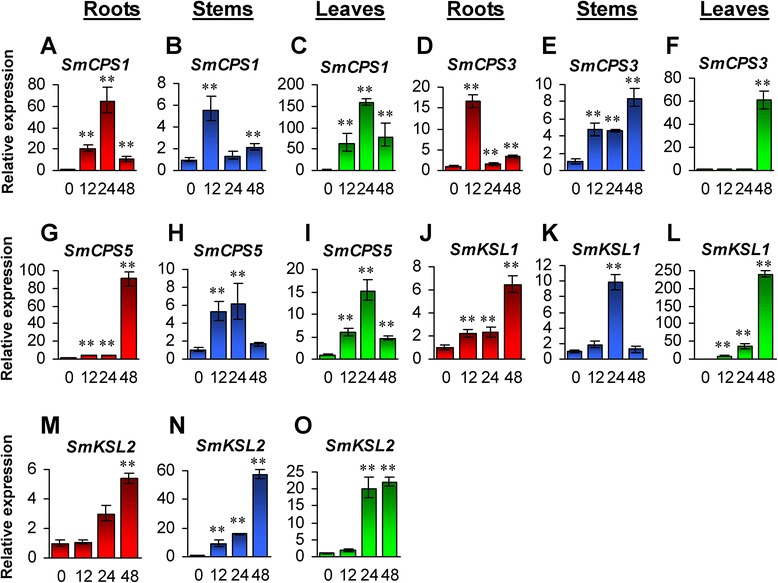
Fig. 10.

Responses of SmCPS and SmKSL genes to exogenous GA3 treatment. Fold changes of SmCPS1 (a–c), SmCPS3 (d–f), SmCPS5 (g–i), SmKSL1 (j–l) and SmKSL2 (m–o) in roots, stems and leaves of S. miltiorrhiza plantlets treated with 100 μM GA3 for 0, 12, 24 and 48 h are shown. The expression levels were analyzed using the quantitative RT-PCR method. Expression level in tissues without treatment (0 h) was arbitrarily set to 1 and the levels in tissues from GA3-treated plantlets were given relative to this. Error bars represent standard deviations of mean value from three biological and four technical replicates. ANOVA (analysis of variance) was calculated using SPSS. P < 0.05 (*) and P < 0.01 (**) was considered statistically significant and extremely significant, respectively
