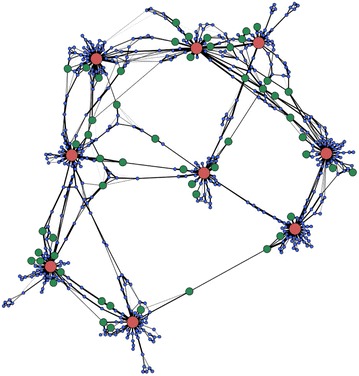
Fig. 3.

Schematic representation of the network formed by the individual biomass components at the end of the simulation. Each circle represents one element of the system: the large red circles are for cellulose fibrils, the small blue circles are for lignin molecules, and the intermediate green circles are for TrCel7A enzymes. The black lines connecting the components indicate a contact between two components, and the thickness represents the degree of contact (the contact number). The position of the individual particles is arbitrary, with the position determined using the ForceAtlas algorithm of Gephi [45], which treats the connection as springs connecting the elements. An animation of the time-evolution of this representation is given as an Additional file 3
