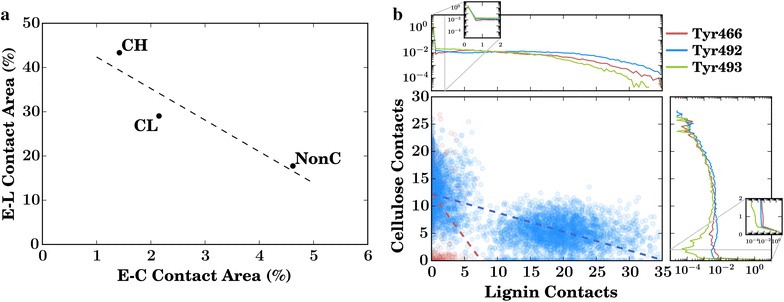
Fig. 7.

a Fraction of hydrophobic cellulose covered by lignin and enzymes per cellulose fibril type. Individual fibril types are labeled. The dotted line is a linear regression to the data. This contains the same information as Table 2. b Comparison of the number of simultaneous contacts between the specific CBM tyrosine residues, with a scatterplot in the main panel, and log-probability distributions for direct comparisons along each axis
