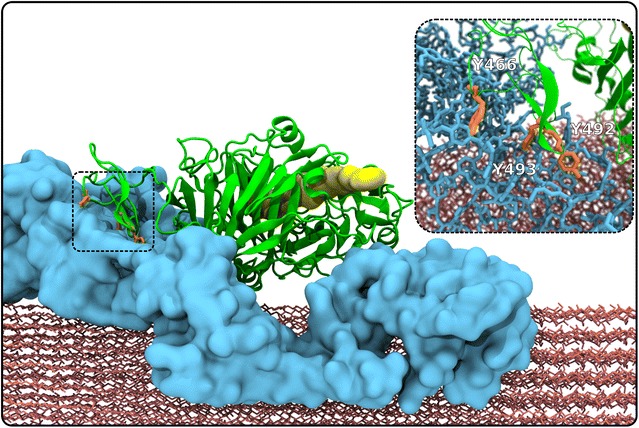
Fig. 8.

Snapshot of the simulation in which TrCel7A (green cartoon) is bound unproductively to a lignin cluster (blue surface) on a cellulose fiber (red). The CBM residues Y466, Y492, and Y493 are orange. The location CD catalytic tunnel is shown by a yellow spacefilling representation, and is provided for reference. No cellulose was within the tunnel at any point during the simulation, as the complete fibrils did not decrystallize. The inset is an enlarged image delineated by the dotted rectangle, which highlights the Tyr (orange)–lignin (blue) interactions. A gallery of images showing the cases where TrCel7A enzymes interact with cellulose are provided in the supplementary information†
