Fig. 4.

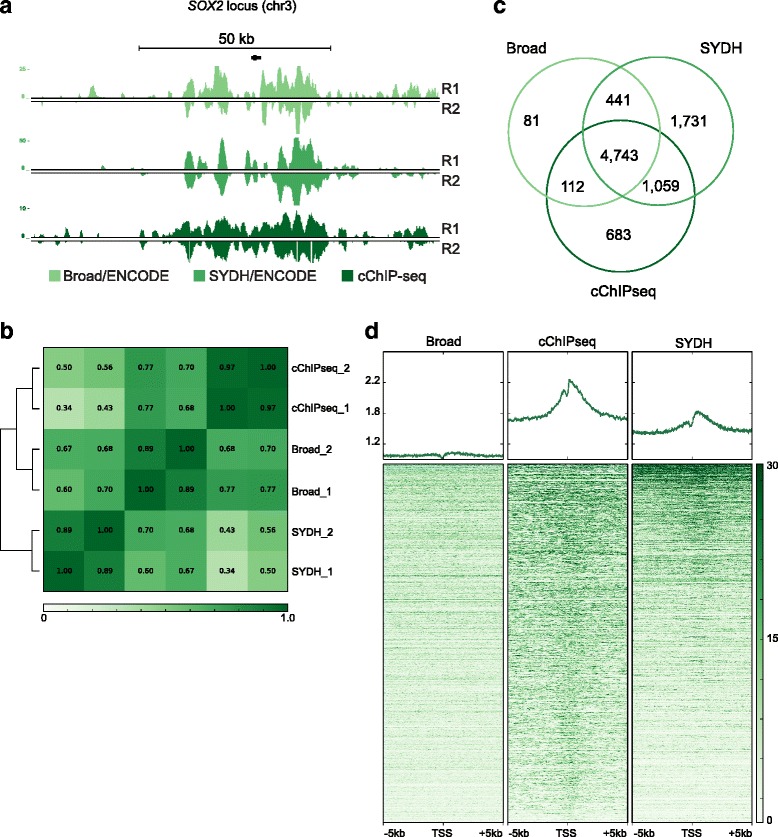
cChIP-seq for H3K27me3 on 10,000 cells in K562 cells. a UCSC genome browser snapshot showing H3K27me3 signal (RPKM input normalized) for cChIP-seq and ENCODE data at the SOX2 locus (chr3). R1: replicate 1; R2: replicate 2. b Pearson’s correlation values heatmap for replicates of cChIP-seq on 10,000 cells and ENCODE data. c Venn diagram shows the number of unique and common regions enriched for H3K27me3 across cChIP-seq, Broad and SYDH datasets. d Heatmap representation of the signal intensity (RPKM input normalized) across cChIP-seq and ENCODE data in a 10 kb window centered at protein-coding transcription start sites (TSS) [GENCODE assembly GRCh37] overlapping ChromaBlocks domains found in any of the three datasets (10,736 TSSs are shown)
