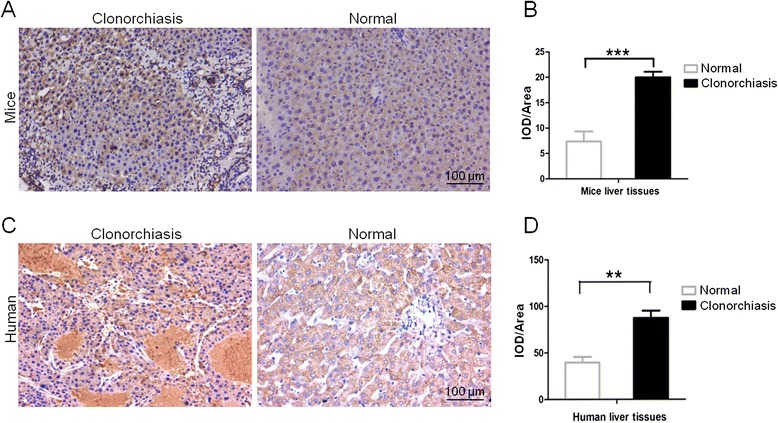
Fig. 6.

Immunohistochemistry assays of CsCB4 in liver tissues. a Representative localization image of CsCB4 in mice liver. c Representative localization image of CsCB4 in human liver. b, d Quantification of Integrated Optical Density (IOD). The images were magnified at 200X and scale bar is 100 μm. The brown staining was indicated as IOD; IOD/Area was indicated as a relative expression level of CsCB4 in liver tissues. Five random fields from each sample were analyzed using ImagePro Plus software. The sections were developed by DAB and counterstained with hematoxylin. **P < 0.01, ***P < 0.001, compared to normal tissue
