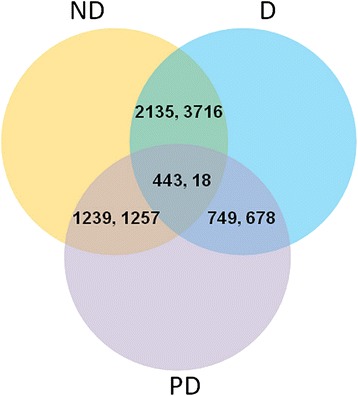
Fig. 6.

Summary of differentially expressed genes in three libraries identified through pairwise comparisons. The overlapping areas represented the genes we filtered by comparing two or three groups. In each pair of values, the first pair represents the number of up-regulated unigenes, and the second pair represents the number of down-regulated unigenes. ND: non-diapause, D: diapause, DT: diapause-terminated
