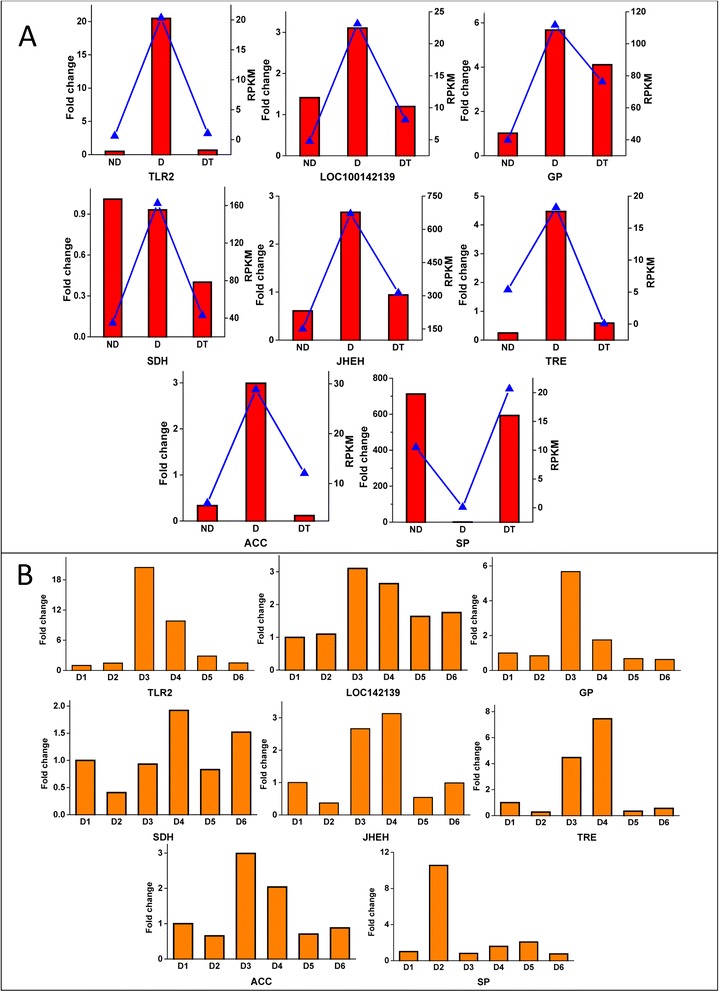
Fig. 8.

Validation of candidate differentially expressed genes. a Expression of differentially expressed genes compared between the qRT-PCR and the RNA-seq results in the three stages: non-diapause, diapause and diapause-terminated. The qRT-PCR results are shown in red, and the values are shown on the left y-axis; the RNA-seq results are shown with blue lines, and the values correspond to the right y-axis. b qRT-PCR validation of 6 treatments at diapause stages D1, D2, D3, D4, D5, and D6,correspondingto 10, 20, 30, 40, 50, and 60 days, respectively
