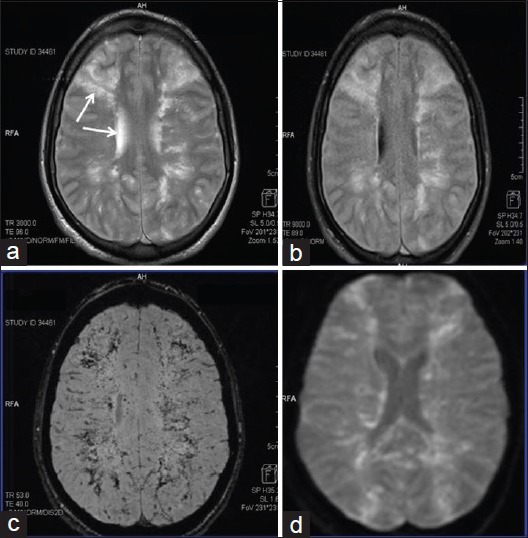
Figure 2.

(a and b) T2-weighted and fluid, attenuated inversion recovery sequences show illdefined hyperintensity seen involving bilateral superficial and deep white matter with periventricular confluences, blooming on susceptibility weighted images (c) and restricted diffusion on diffusion-weighted images (d) suggestive of fat embolism
