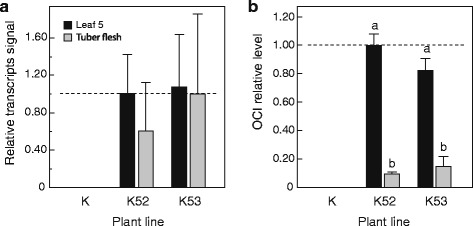
Fig. 1.

OCI expression in leaves and tubers of line K52, line K53 and control line K. a mRNA transcript relative levels in tuber flesh and leaf 5 down from the apex. b OCI relative content in tuber flesh and leaf 5 down from the apex. Data on panels (a) and (b) are expressed relative to mean levels in the fifth leaf of K52 plants (arbitrary value of 1.00, corresponding on panel (b) to ~0.85 % of total soluble proteins [24]). Each bar on both panels is the mean of biological replicates from three different plants ± sd. Bars with different letters on panel (b) are significantly different (post-anova Tukey’s test, P < 0.05)
