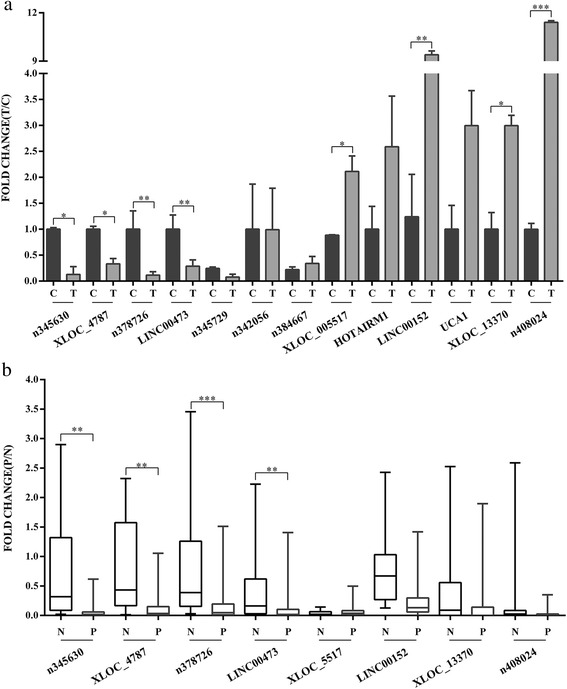
Fig. 4.

Expression patterns of the candidate lncRNAs in cells and clinical tissue samples. a: QRT-PCR validation of 13 candidate lncRNAs relative expression levels in H.pylori-infected GES-1 cells compared with controls. “Column T” represents experimental groups, and “column C” represents control groups. b: QRT-PCR validation of eight lncRNAs in 156 clinical tissue samples. “Column P” stands for H.pylori-positive tissue samples, and “column N stands for H.pylori-negative tissue samples. All results were expressed as the means ± SD of three independent experiments with significant P-values (*P < 0.05, **P < 0.01, ***P < 0.001)
