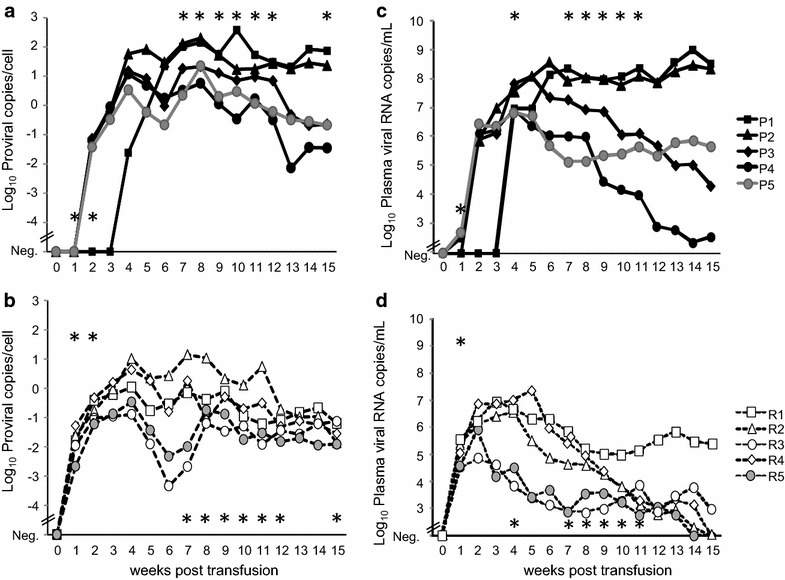
Fig. 1.

Proviral blood loads (a, b) and plasma viral RNA loads (c, d) of the five cats in group A (a, c) and the five cats in group B (b, d). The proviral loads are provided as proviral copies/cell. In the cats in group B, the FeLV provirus was detectable significantly earlier (in week 1) than in the cats in group A (pFisher = 0.0079). The cats in group B had significantly higher proviral loads in weeks 1 and 2 but lower loads in weeks 7–12 and 15 (pMWU < 0.05; indicated by an asterisk). The plasma viral RNA loads are provided as copies/mL of plasma. The cats in group B had significantly higher viral RNA loads in week 1 but lower loads in weeks 4, and 7–11 (pMWU ≤ 0.05; indicated by an asterisk). All cats in group C were negative at all tested time points (data not shown)
