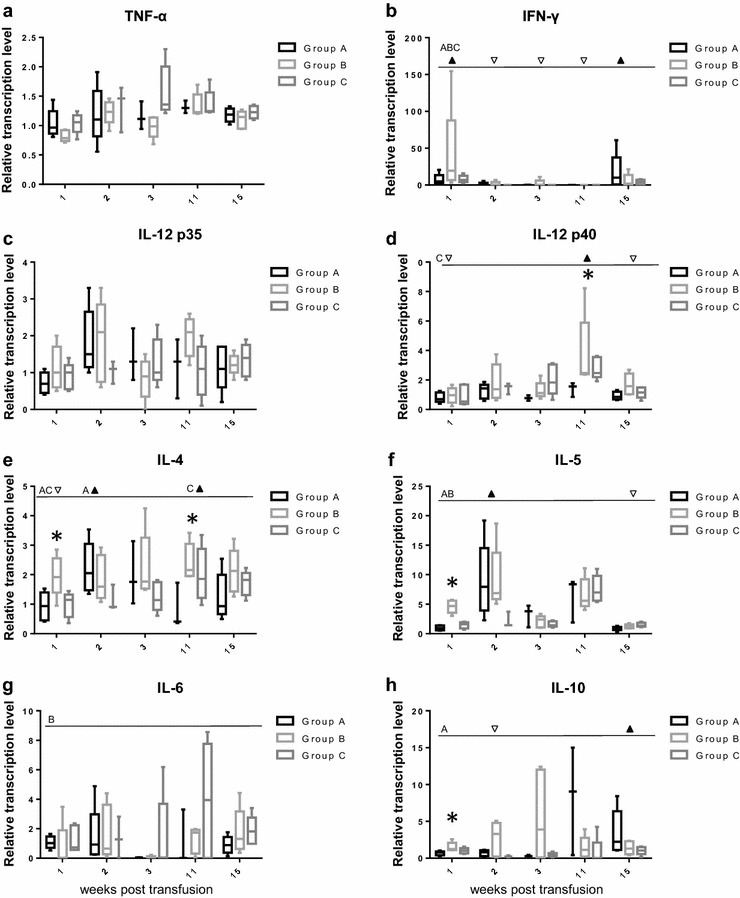
Fig. 5.

Transcription levels of cytokines after blood transfusion in the three groups of cats A, B and C a TNF-α, b IFN-γ, c IL-12 p35, d IL-12 p40, e IL-4, f IL-5, g IL-6 and h IL-10. The cytokine transcription levels were normalized to the transcription levels of two housekeeping genes (ABL and YWHAZ) at each time point and used to calculated relative transcription levels in relation to the levels in week 0 using GeNorm. Significant changes over time were tested by the Friedman test for each cytokine and each group, separately; significant differences are indicated by a dotted line; significantly higher (upfilled-pointing triangle) and lower (down-pointing triangle) time points in the Dunn’s posttest (PD) are denoted and the relevant group is listed (A, B or C). Significant differences between the three groups at one time point were tested using the Kruskal–Wallis test and are indicated by an asterisk
