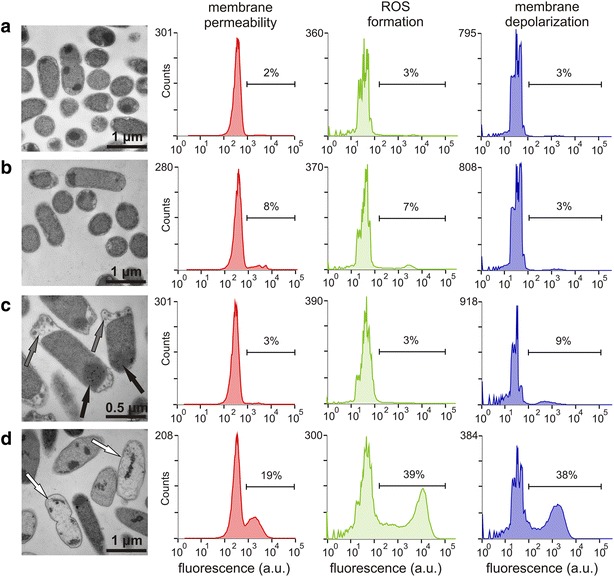
Fig. 3.

Transmission electron microscopy of Escherichia coli deg31 cells and corresponding histograms showing the physiological state of populations stained with selected fluorescent dyes. a Non-induced cells incubated in phosphate buffer. b Non-induced cells incubated in phosphate buffer with 2 mM TCP. c Cells pre-induced with 0.2 mM IPTG incubated in phosphate buffer. d Cells pre-induced with 0.2 mM IPTG and incubated in phosphate buffer with 2 mM TCP. Black arrows indicate bodies that presumably consist of overexpressed heterologous proteins, grey arrows indicate separations of the inner and outer cell membranes, and white arrows indicate dead or dying cells
