
Fig. 1.
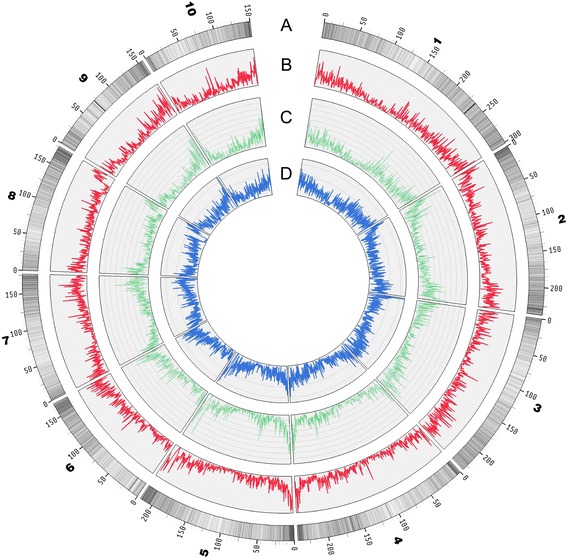
Genome-wide SNP distribution and genetic variation throughout the maize genome. a. Gene density of chromosomes is visualized by line darkness and the gene density is proportional to color depth. b. Density of genic SNPs on chromosomes are visualized by line redness. c. Density of SNPs in CDS (Coding Sequence) is visualized by line greenness. d. Density of Indels (insertions or deletions) are visualized by line blueness