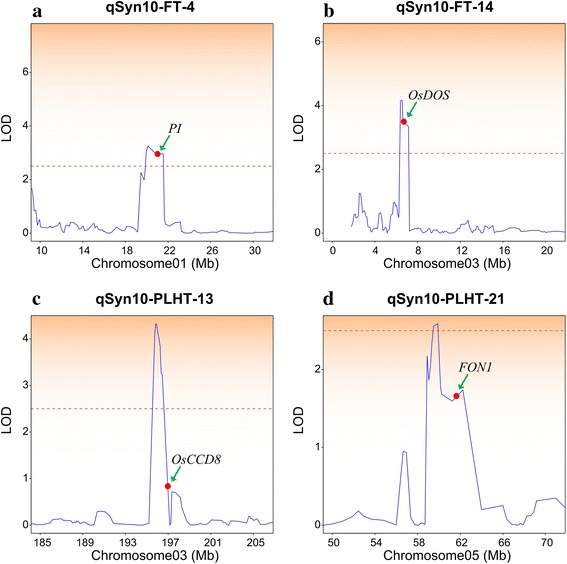
Fig. 8.

Precise location of 4 QTL harboring 4 candidate genes. The head of each sub-plot is the code name of QTL. Curves in plot indicate the physical coordinate (X-axis) and LOD (Y-axis) values of detected QTL. The red dash line indicates the LOD threshold (LOD=2.5). Arrowheads represent the relatively physical position of a candidate gene. qSyn10-FT-4, 14 indicated the QTLs detected in IBM Syn10 population for flowering time (a and b), qSyn10-PLHT-13, 21 indicated the QTLs detected in IBM Syn10 population for plant height (c and d).
