Fig. 4.

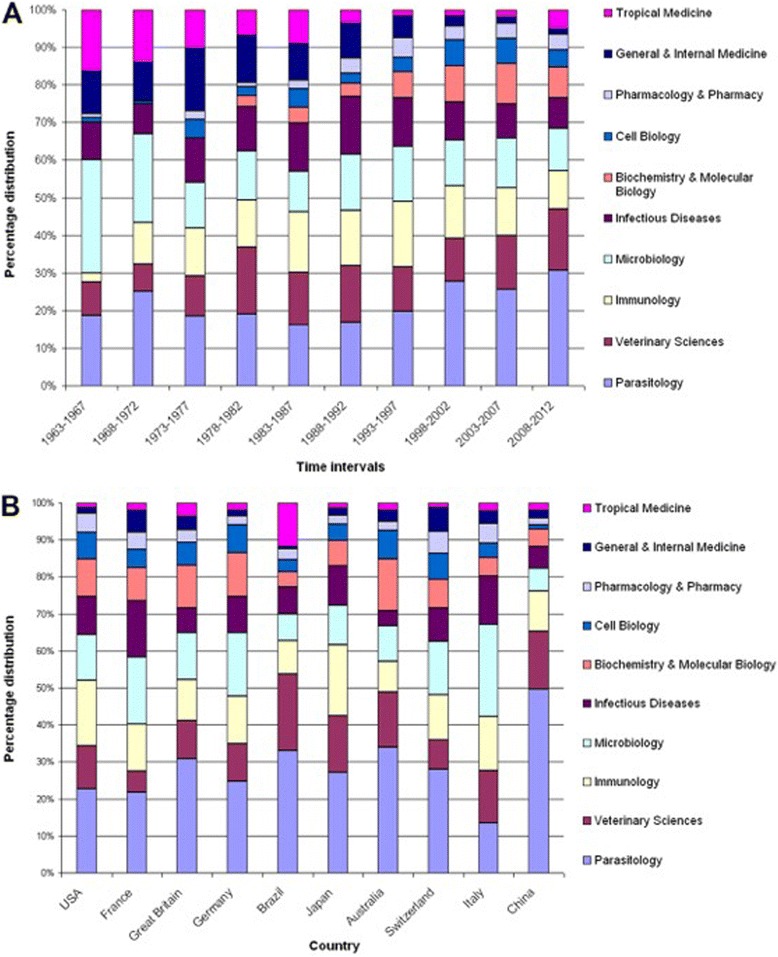
Subject area analyses. a Relative proportions of subject areas in 5-year intervals between 1963 and 2012. b Relative proportions of subject areas in most active countries

Subject area analyses. a Relative proportions of subject areas in 5-year intervals between 1963 and 2012. b Relative proportions of subject areas in most active countries