
Fig. 3.
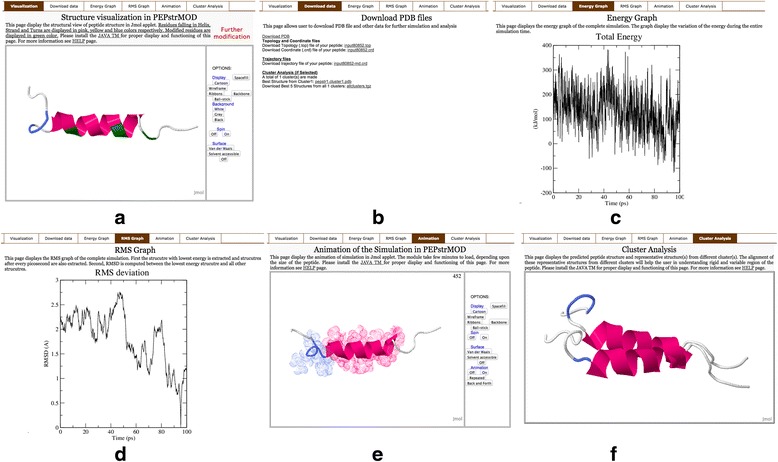
Graphical representation of the result page of PEPstrMOD with multiple tabs. a Visualization of the predicted structure using Jmol Viewer. b Links to download PDB file of predicted structure, topology, coordinate, trajectory files and representative structures from cluster analysis. c Energy graph of the simulation. d RMS graph of the simulation. e Visualization of the simulation in animated form. f Visualization of the alignment of predicted structure and representative structures obtained after cluster analysis