
Fig. 2.
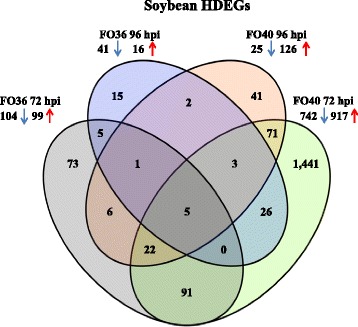
Venn diagram of soybean highly differentially expressed genes (HDEGs) at two inoculations stages (72 and 96 h post inoculation) with F. oxysporum FO36 and FO40 isolates, respectively, in the resistant soybean genotype Forrest. Blue coloured down arrow indicates down-regulation of genes and red coloured up arrow indicates up-regulation