
Fig. 6.
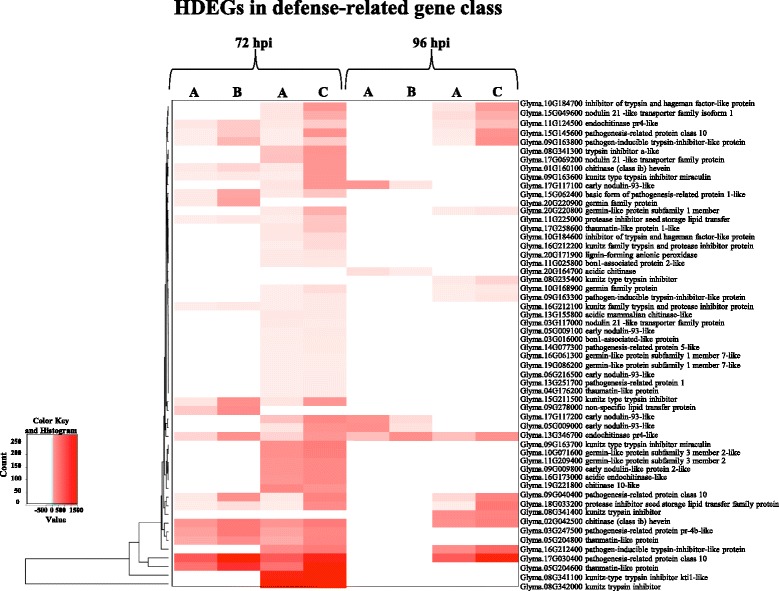
Clustering and heatmap of soybean highly differentially expressed genes (HDEGs) in the defense-related gene class. Description of each gene as obtained from Blast2GO annotation are shown. Light and dark red indicate lower and higher expression values, respectively. White indicates genes that are not DE. Expression heatmaps were plotted using normalized read counts. a: Control; b: inoculated with non-pathogenic F. oxysporum isolate FO36; c: inoculated with pathogenic F. oxysporum isolate FO40