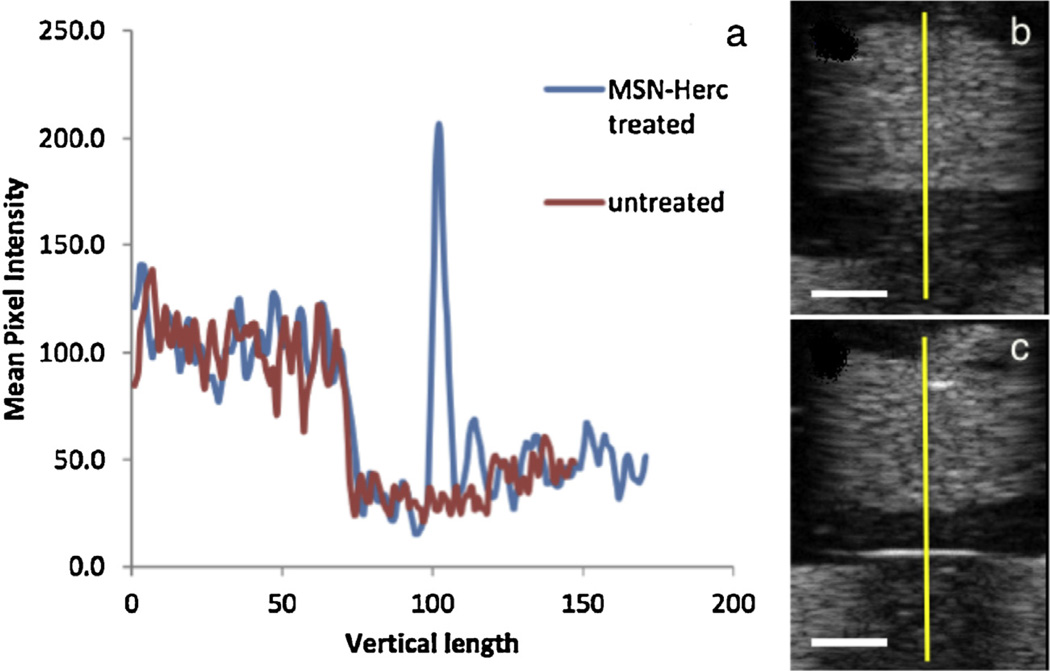
Fig. 5.
(a) Ultrasound contrast profile of (b) HER2+ (SK-BR-3) cells not treated with MSN-Herceptin (red line), and (c) HER2+ cells treated with MSN-Herception (blue line). The pixel intensity profile was graphed along the y dimension indicated by the yellow line. Scale bar: 5 mm. (For interpretation of the references to colour in this figure legend, the reader is referred to the web version of this article.)

