FIGURE 3.
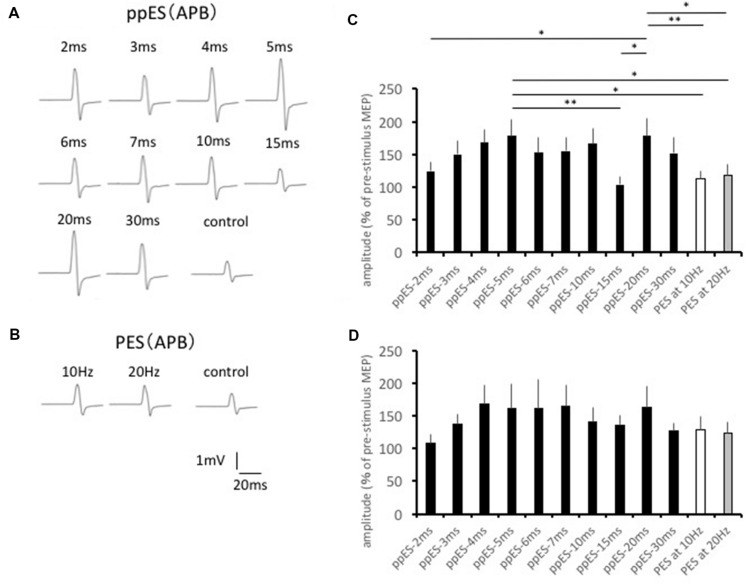
The effect of short-duration ppES and PES on the MEP recorded in the abductor pollicis brevis (APB) muscle. (A) Typical MEP waveforms recorded in APB muscle in response to ppES. (B) Typical MEP waveforms recorded in APB muscle in response to PES. (C) The changes in the group mean MEP of APB muscle (n = 12) induced by each stimulus condition. The value was expressed as the percentage of baseline MEP measured before the stimulation. One-way-repeated measured ANOVA identified a significant main effect for the stimulus condition on MEP amplitude in APB muscle [F(11,121) = 4.175, p = 0.000, MSE = 1901.679, η2 = 0.28]. A ppES-5 ms was more effective for increasing MEP compared with ppES-20 ms, and PES at 10 Hz and 20 Hz (all p < 0.05). ∗p < 0.05, ∗∗p < 0.01. Error bars indicate standard error (SE). (D) The changes in the group mean MEP of ADM muscle (n = 12) induced by each stimulus condition. There was no significant modulation of MEP induced by ppES and PES [F(11,121) = 1.822, p = 0.057, MSE = 2602.381, η2 = 0.14]. Error bars indicate SE.

