
Figure EV3. Biochemical analysis of the XBP1 splicing product.
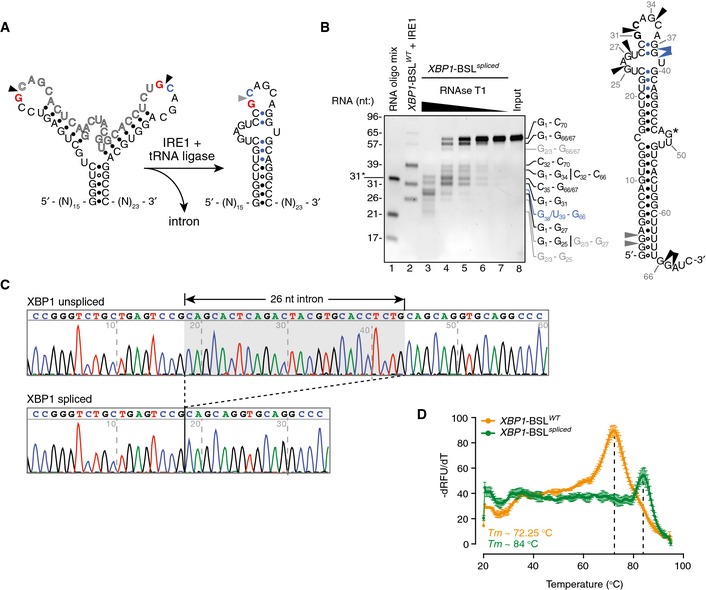
- Secondary structures of the short RNA transcripts harboring the human XBP1‐BSL (left structure) or its corresponding spliced RNA (right structure). Arrowheads: scissile bonds (unspliced structure); exon–exon junction (spliced structure). The exon boundaries are indicated by a red guanosine, a blue cytosine. Blue closed circles: Watson–Crick base pairing between the 5′ and 3′ exons that form ES1.
- Left: TBE–urea gel showing the ribonuclease T1 (RNase T1) mapping of the XBP1‐BSL spliced RNA. RNA ladders: RNA oligo mix (lane 1), and IRE1‐cleaved XBP1‐BSLWT (lane 2). 31* indicates the migration of a 2′‐ACE‐(acid‐labile orthoester)‐protected RNA oligonucleotide. The XBP1‐BSL‐derived RNA ladder was cleaved with 0.5 μM of IRE1α‐KR43. The fragments generated by RNase T1 are indicated on the right side of the gel and color coded according to their origin (see schematic). Right: schematic of the XBP1‐BSL spliced transcript. Blue: closed circles: Watson–Crick base pairs between the 5′ and 3′ exons that form ES1. Black arrowheads: preferred cleavage sites by RNase T1. Blue arrowheads: overdigestion products generated when the distal C‐G pairs of ES1 are melted. Grey arrowheads: possible cleavage products resulting from the melting of G‐U wobble base pairs at the beginning of the main stem S1. G* indicates a single inaccessible single‐stranded guanosine.
- Electropherograms showing the sequencing analysis of in vitro‐generated splice products using XBP1‐BSLWT as a substrate.
- Melting curves of the XBP1‐ BSLWT or XBP1‐ BSL spliced RNA transcripts. The melting curve analysis is consistent with the faster‐than‐expected mobility of the spliced RNA in TBE–urea–PAGE gels (this RNA migrates faster than its predicted molecular size of 70 nt, see B), which suggests it is partially denatured during TBE–urea–PAGE electrophoresis. Mean ± SD.