Figure 3.

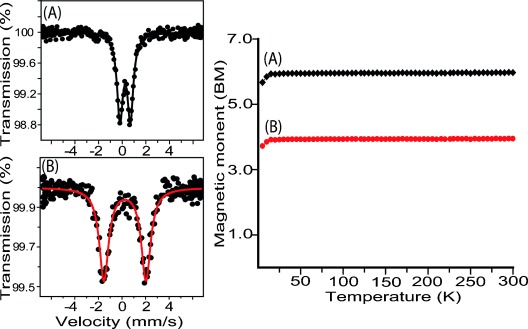
Left: Mössbauer spectra at 295 K and right: plot of magnetic moment versus temperature (K) of the microcrystalline samples of A) 1 and B) 2.

Left: Mössbauer spectra at 295 K and right: plot of magnetic moment versus temperature (K) of the microcrystalline samples of A) 1 and B) 2.