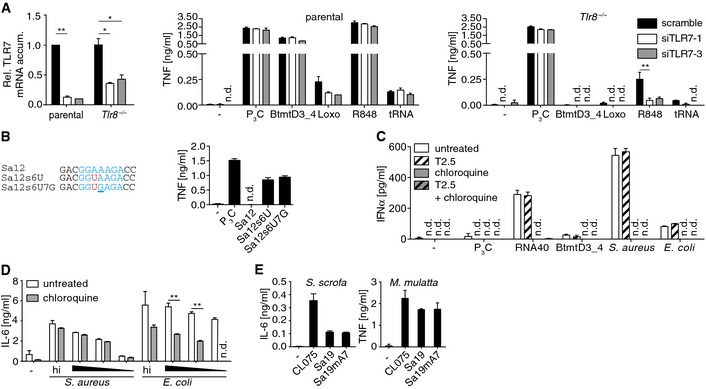
Figure EV3. TLR7 mRNA knockdown in k.o. THP‐1 cells and consequent responsiveness, Sa12 derivative sensitivity, bacterial infection‐driven type I IFN or IL‐6 production and inhibition of PBMCs or whole blood, respectively, and further species PBMC responsiveness.

- Knockdown upon transfection of control (scramble) or two different TLR7 mRNA‐specific siRNAs (siTLR7‐1/3) in and cytokine release of respective 3‐day differentiated THP‐1 cells upon challenge (Rel., relative; accum., accumulation; Loxo, loxoribine; R848, small molecule, 50 μg/ml; tRNA, 200 ng/well of 96‐well plate E. coli transfer RNA; n = 3).
- Sequence alignments of Sa12 and Sa12s6U with another Sa12 variant carrying in addition, as compared to the latter, ORN and, reminiscent of the respective motif in HsmtD1, a UGA motif (blue, core sequence; red, A6U; underlined, A7G). Diagram depicts PBMC activities upon challenges with Sa12 and derivatives (n = 3).
- PBMC type I IFN production upon pretreatments (T2.5, TLR2‐neutralizing mAb; chloroquine, lysososmal function inhibitor) and challenge with TLR ligands or infection (5 × 10⁴ cfu/ml; n = 2; corresponding to Fig 4B).
- Cytokine release of whole blood culture upon lysosome inhibition and challenge with heat‐inactivated (hi) and viable bacteria (triangle, decreasing dose of infection; n = 3; corresponding to Fig 4C).
- Cytokine release of Sus (S.) scrofa and Macaca (M.) mulatta PBMCs upon challenge with ORN variants (n = 3).
