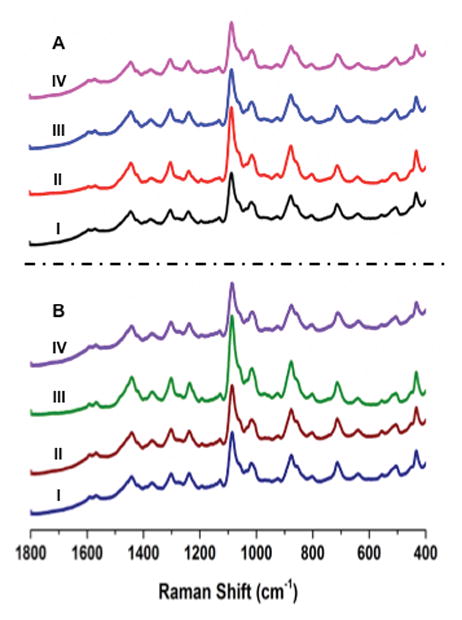
Figure 3.

(A) SERS spectra of the high NA-EIV DNA probe with targets. Each spectrum in this figure is an average of 20 unprocessed SERS spectra.
I) High NA-EIV DNA probe with MCH spacer on AuNP substrate. Also, high NA-EIV DNA probe-spacer complex incubated with: II) high NA-EIV A/ck/Hubei/327/2004/H5N1, III) low NA-EIV A/Gs/Gd/1/96/H5N, and IV) high NA-EIV A/WSN/33/H1N1.
(B) SERS spectra of the low NA-EIV DNA probe with targets. Each spectrum in this figure is an average of 20 unprocessed SERS spectra.
I) Low NA-EIV DNA probe with MCH spacer on substrate. Also, low NA-EIV DNA probe-spacer complex incubated with : II) low NA-EIV A/Gs/Gd/1/96/H5N1, III) high NA-EIV A/ck/Hubei/327/2004/H5N1, and IV) high NA-EIV A/WSN/33/H1N1 RNA sequences.
