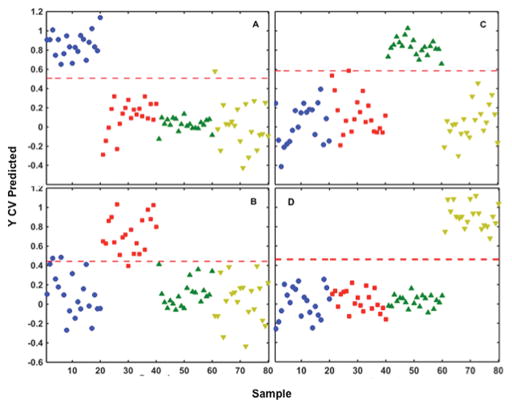
Figure 7.
PLS-DA prediction plots for the low NA-EIV assay. A total of 80 spectra are represented in each plot, with 20 replicates in each group. Each colored symbol represents the PLS predicted value for an individual SERS spectrum after incubation of synthetic RNA strains at 37°C for 2 hours with the low NA-EIV DNA probe. The threshold for class discrimination is indicated by the red dashed line.
(A–D) The colored symbols represents SERS spectra containing: the low NA-EIV RNA strains of A/Gs/Gd/1/96/H5N1 (
 ) and the high NA-EIV RNA strains of A/ck/Hubei/327/2004/H5N1 (
 ), and A/WSN/33/H1N1 (
 ) incubated with low NA-EIV DNA probe. Low NA-EIV DNA probe with MCH spacer was used as control (
 ).
).

