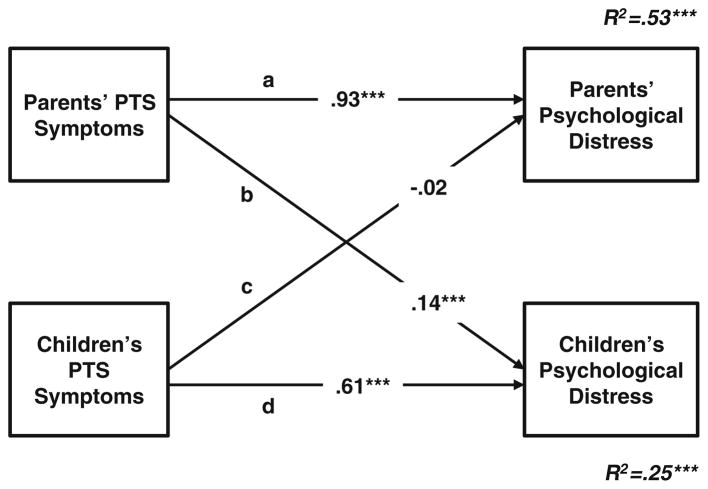
Fig. 1.
Standardized beta coefficients of APIM analyses regressing parents’ and children’s PTS symptoms on general distress (n=397 dyads). Actor effects are represented by Paths a and d. Partner effects are represented by Paths b and c. R2s represent the variance in parents’ and children’s general distress explained by the model. 95 % Confidence Intervals: Path a (0.85, 1.02), Path b (0.06, 0.22), Path c (−0.14, 0.10), Path d (0.50, 0.72). Standard Errors of beta coefficients: Path a (0.04), Path b (0.04), Path c (0.06), Path d (0.05). ***p<0.001

