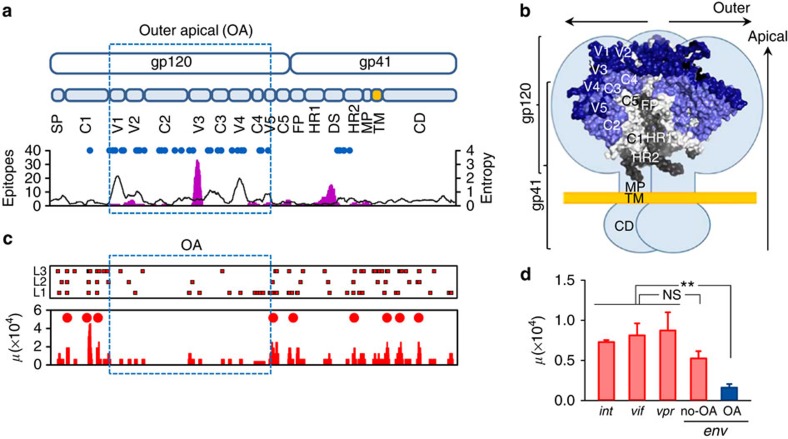
Figure 2. Structure of the HIV-1 envelope and location of spontaneous mutations across env.
(a) Top: map of the env gene (SP: signal peptide; V1–V5: variable regions; C1–C5: more conserved regions between the V regions; FP: fusion peptide and FP proximal region; HR: heptad repeat; DS: disulfide loop; MP: membrane-proximal ectodomain region; TM: transmembrane domain; CD; C-terminal domain). The 1 kb region encoding the extensively glycosylated outer-apical domains of gp120 is boxed. Bottom: glycosylation sites (blue dots), number of B-cell epitopes (pink histogram), and protein sequence variability calculated as the Shannon entropy averaged over a 15-residue sliding window (black skyline). Epitopes and entropy were retrieved from the HIV Immune and Sequence Databases. (b) Structure of the HIV-1 envelope trimer. Each light-blue lobe represents schematically an envelope monomer embedded in the viral membrane (yellow), and superimposed is a surface representation of the crystal structure available for a portion of the trimer including most of gp120 and segments of gp41 (PDB file: 4NCO). The five variable regions are shown in dark blue, and the more conserved segments C2–C4 also belonging to the outer-apical domains are shown in slate. The three gp41 subunits are coloured in grey tones. The various regions are labelled only in one subunit of each gp120 and gp41 for clarity. The structure shown corresponds to the closed conformation found at the surface of free virions. (c) Top: nucleotide substitutions found in env for each of the lines L1–L3 after four infection cycles. Red squares indicate individual mutations. Bottom: mutation rate (μ) averaged over 15-base sliding window (red bars). Significant mutation clusters are indicated with red circles. (d) Mutation rate in the int, vif, vpr and env genes, showing the lower mutation rate in the gp120 outer-apical domains (OA, blue). **t-test: P<0.01; NS: not significant (n=3). Error bars indicate the standard error of the mean. The exact location of each mutation is provided in Supplementary Data 3 (env) and in Supplementary Data 4 (int–vif–vpr).

