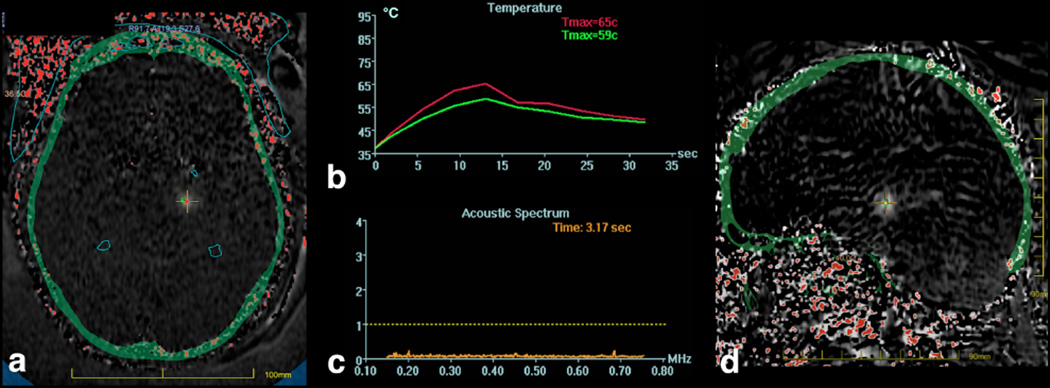
Figure 3.
MR temperature maps in a and d derived from the change in proton resonant frequency seen with temperature. The skull is overlaid on the temperature image in green. A cross hair is placed at the location of the focal spot, with the maximum temperature within a 3×3 region of interest plotted in b), along with the average in the 3×3 pixel region of interest. These curves demonstrate an exponential rise in temperature during the sonication, and the exponential decay in temperature after the sonication is ended.

