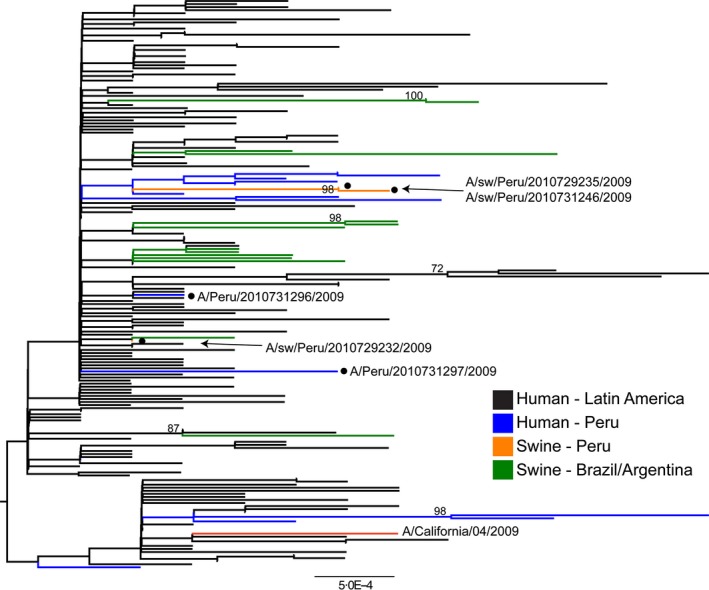
Figure 3.

Maximum‐likelihood phylogeny of concatenated hemagglutinin and neuraminidase gene sequences from influenza A(H1N1)pdm09 viruses from Latin America, 2009–2011. Virus sequences shown were collected from three swine (orange with circles) and two humans in Tumbes (blue with circles) (see explanation in text), 13 swine in Argentina and Brazil (green), 14 humans in other sites in Peru (blue), 132 humans in other Latin American countries (black), and the red line: Influenza A/California/07/2009. Bootstrap values >70 are included for key nodes, and tree is midpoint rooted for clarity only. GenBank accession numbers of the sequences used in this analysis are listed in Appendix 2.
