
Figure 1.
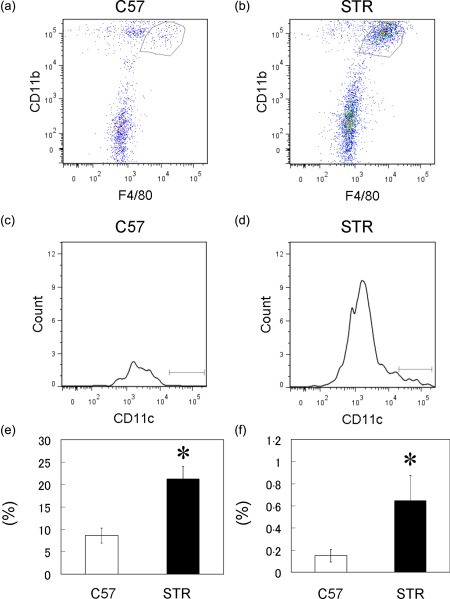
Flow cytometric analysis of CD11c+F4/80+CD11b macrophage cells in the synovial tissue (ST) of C57BL/6J (C57) and STR/Ort (STR) mice. (a,b) Dot‐plot analysis of F4/80+CD11b+ cells in ST of C57 (a) and STR mice (b); x‐axis, F4/80; y‐axis, CD11b. (c,d) Histogram analysis of CD11c+ cells in the gated regions in the dot‐plots of ST cells isolated from C57 (c) and STR mice (d). Percentages of F4/80‐ and CD11b‐positive cells (e) and CD11c+ cells in F480‐ and CD11b‐positive gated regions in ST of C57 and STR mice (f) (n = 5). [Color figure can be viewed in the online issue, which is available at wileyonlinelibrary.com.]