
Figure 3.
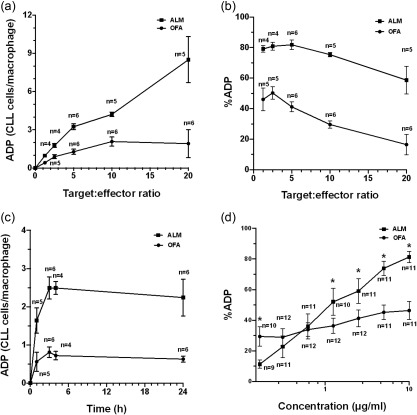
Antibody‐dependent phagocytosis (ADP). We tested the effects of variation of the target : effector ratio, duration of co‐culture and monoclonal antibody (mAb) concentration on ADP of chronic lymphocytic leukaemia (CLL) cells treated with ofatumumab (OFA) or alemtuzumab (ALM). ADP was measured as either the mean increase in the number of CLL cells phagocytized by each macrophage compared to no‐mAb controls for each patient (CLL cells/macrophage) or as the percentage increase of phagocytosis for each measurement compared to the no‐mAb control (%ADP). (a) Phagocytosis was compared at target : effector ratios of 1·25 : 1, 2·5 : 1, 5 : 1, 10 : 1 and 20 : 1 with 10 μg/ml of mAb and a 3 h co‐incubation in samples from nine CLL patients (three comparisons were performed in paired samples; there were no replicate assays). The ADP measured as the mean number of CLL cells phagocytized per macrophage increased with higher target : effector ratios for CLL cells opsonized with ALM. In contrast, ADP of cells opsonized with OFA reached a maximum (mean = 2·1 additional cells/effector, range = 1·5–3·5) at a target : effector ratio of 10 : 1. (b) %ADP was higher at lower CLL target levels and decreased as more target cells were available for phagocytosis. (c) ADP kinetics was measured at 1, 3, 4 and 24 h in co‐cultures using 10 μg/ml of mAb and a target : effector ratio of 5 : 1 in samples from six CLL patients (all samples were paired with no replicate assays). The mean number of CLL cells phagocytized by each macrophage increased for 3 h and then reached a plateau for both OFA and ALM. The same number of paired specimens were analysed at each point for ALM and OFA ADP. (d) Dose–responses were measured for OFA and ALM (concentrations 0·156, 0·31, 0·625, 1·25, 2·5, 5 and 10 μg/ml) in co‐cultures with target : effector ratios of 5 : 1 incubated for 3 h in paired samples from 12 CLL patients with no replicate assays. %ADP increased progressively in cells treated with ALM from 0·156 to 5 μg/ml, with no further significant increase from 5 to 10 μg/ml. In contrast, OFA was significantly more effective at inducing ADP compared to ALM at the lowest concentration tested (0·156 μg/ml) (P = 0·022), but at a mAb concentration of 1·25 μg/ml %ADP was significantly lower for OFA compared to ALM (P = 0·004). *Significant differences. Means and standard errors are displayed.