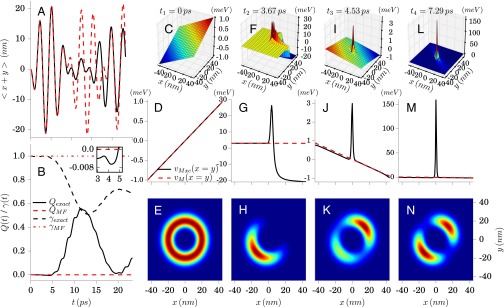
Fig. 3.
Coherent state as initial state for the photon mode: In A we display the dipole of the exact (black) and mean-field (red) time evolution. In B we contrast the exact Mandel parameter (see main text for definition) (solid black) and (dotted black) with the corresponding mean-field values (red). C, F, I, and L show the corresponding Mxc potentials at different times (); D, G, J, and M show the corresponding diagonal cuts of the Mxc potentials; and in E, H, K, and N we present the corresponding densities. The Inset in B shows Q(t) between t = 3 and 5 ps. The negative Q(t) in the exact solution indicates nonclassical behavior in the photon mode. Movie S2 shows the full time evolution from 0 to 23 ps.

