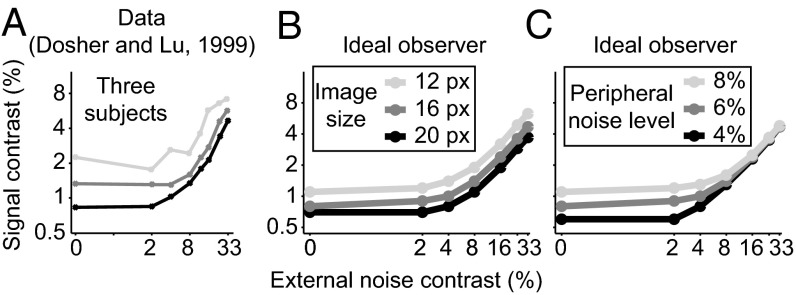
Fig. 9.
Assessing optimality of orientation discrimination performance in trained human subjects. (A–C) Threshold vs. contrast curves for three human subjects as in ref. 53 (A) and the ideal observer (B and C). The ordinate represents the grating contrast required to achieve a discrimination performance of 79.3% correct, at each noise level (abscissa). The derivation of stimulus parameters and ideal observer are in SI Appendix, section 8. Different shades of gray correspond to different experimental subjects (A), different assumptions about the number of pixels in the image (B), and different assumptions about the peripheral noise level (C). Data from ref. 53.

