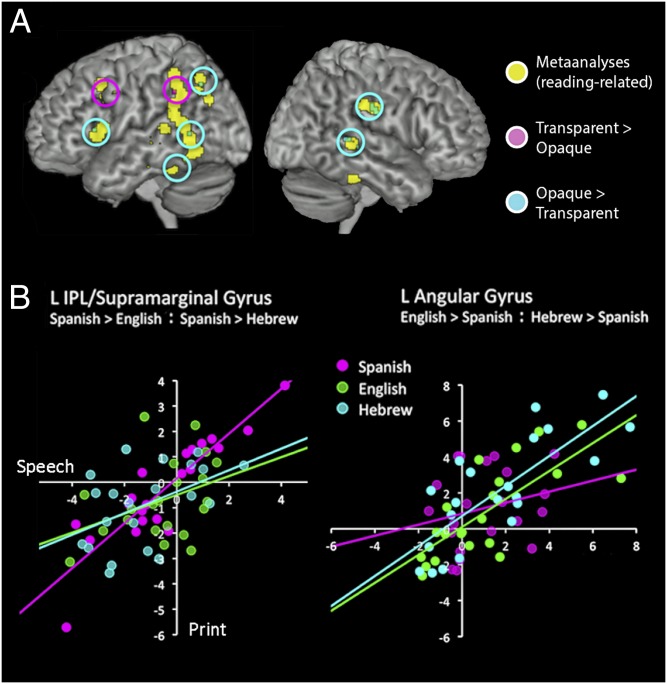
Fig. 4.
Print and speech convergence as a factor of orthographic depth. (A) Areas in yellow show the reading circuit identified by published meta-analyses. Speech–print correlations were higher for transparent (Spanish) than opaque orthographies (English and Hebrew compared independently, P < 0.05 for each comparison) in areas shown in pink. Areas shown in light blue show higher correlations for the opaque orthographies compared with the transparent orthography, P < 0.05. (B) Scatter plots of the correlation between print and speech activation in representative areas showing greater convergence for more transparent languages in left inferior parietal lobule, supramarginal gyrus (Left), and left angular gyrus for opaque languages (Right). Fisher’s R-to-Z transform was performed to calculate statistical significance.

