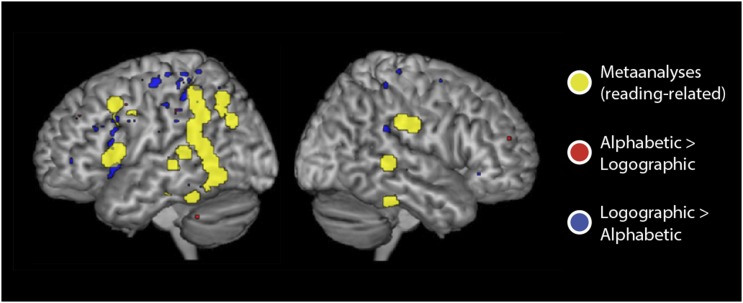
Fig. 5.
Areas in which speech–print convergence differed for alphabetic orthographies (Spanish, English, Hebrew) compared independently with the logographic orthography (Chinese), each comparison P < 0.05, corrected. Areas shown in blue showed greater convergence for the logographic than the alphabetic orthographies; areas in red showed the opposite pattern. Areas in yellow provide a reference to the reading circuit identified by published meta-analyses.

