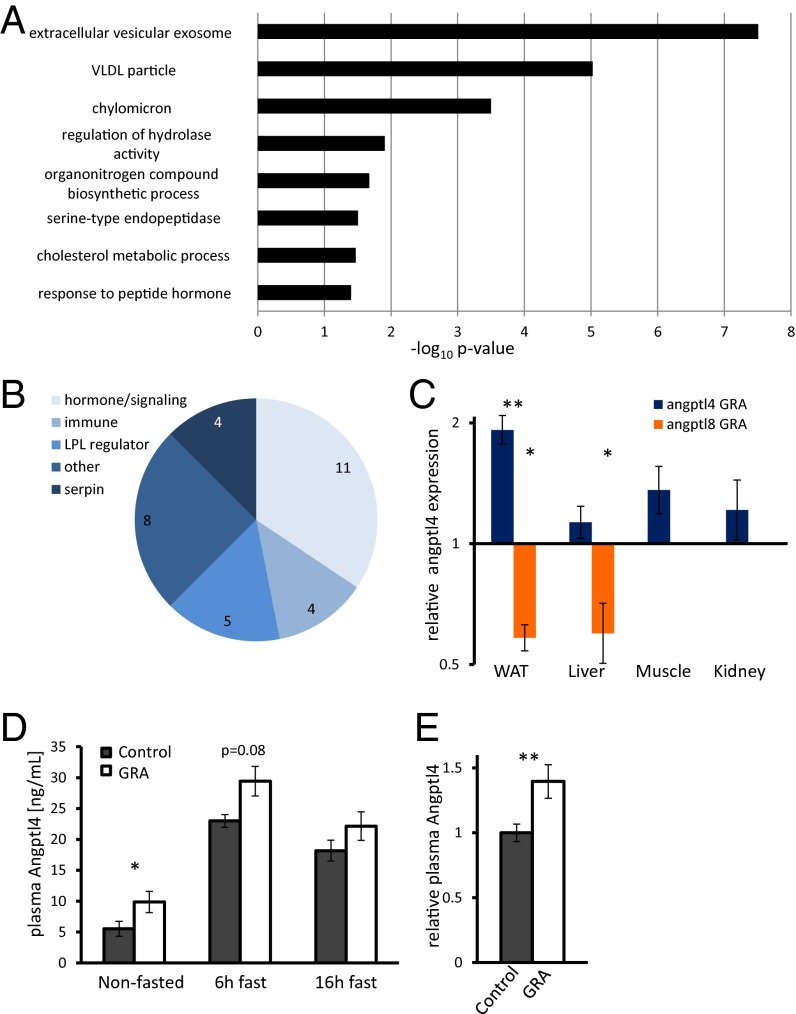
Fig. 2.
Gene expression analysis in white adipose tissue following GRA identifies up-regulation of Angptl4. (A) Overrepresented gene ontology terms in WAT following GRA administration. Genes with a fold change >1.5 and differential expression P value < 0.05 were chosen for this analysis. (B) Classification of extracellular proteins significantly differentially expressed (P < 0.005). See Dataset S1. (C) qPCR analysis showing fold change in gene expression in angptl4 (blue) and angptl8 (orange) across tissues following 7 d of GRA treatment relative to nontreated controls. P = 0.009; P = 0.03 (WAT); P = 0.05 (liver); n = 3. (D) Plasma levels of Angptl4 in GRA and control mice. n = 5. P = 0.04 (nonfasted). (E) Relative plasma levels of Angptl4 in GRA and control mice during the day. Angptl4 levels were normalized to control level at the same feeding/fasting state to demonstrate overall increase in Angptl4 levels. P = 0.006; *P < 0.05; **P < 0.01.

