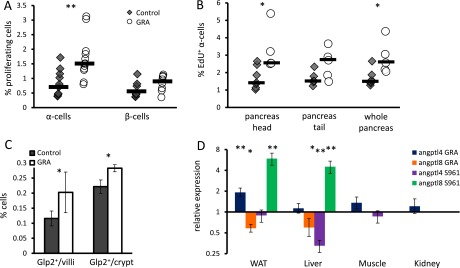
Fig. S1.
Supporting figure for Figs. 1 and 2. (A) Percentage of Ki67-positive cells in control and GRA-treated mice. Each point represents a single mouse; black horizontal line is the median. n = 10. P = 0.003 for α-cells; P = 0.17 for β-cells. (B) Percentage of EdU-positive α-cells in control and GRA-treated mice. Each point represents a single mouse; black horizontal line is the median. n = 5. P = 0.02 (head), 0.07 (tail), and 0.02 (whole pancreas). (C) Glp2-positive cells per crypt or villus in ileum of 8-wk-old mice treated for 7 d with GRA or PBS. P = 0.03; n = 5–7. (D) Fold change in gene expression following a 7-d treatment with GRA or insulin receptor inhibition by S961 (41). In GRA-treated animals, tissues were collected following overnight fast, and qPCR was used to generate the data as in Fig. 2C. In S961, tissues were collected from nonfasted animals, and we present published data from microarrays (41).

