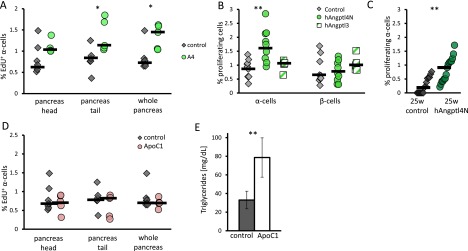
Fig. S2.
Supporting figure for Fig. 3. (A) Percentage of EdU-positive α-cells in control and mAngptl4-treated mice. Each point represents a single mouse, black horizontal line is the median. n = 5–7. P = 0.1 (head), 0.003 (tail), 0.01 (whole pancreas). (B) Percentage of Ki67-positive α- and β-cells in young mice following a 3-d treatment with hAngptl4N or BSA. n = 9, 10. P = 0.004. (C) Percentage of Ki67-positive α-cells in 5- to 6-mo-old SCID beige mice following a 3-d treatment with hAngptl4N or BSA. n = 16, 17. P = 0.002. (D and E) Percentage of Ki67-positive α-cells (D) and triglyceride levels (E) in overnight-fasted mice treated with ApoC1 for 3 d or BSA (control). Each point represents a single mouse; black horizontal line is the median.

