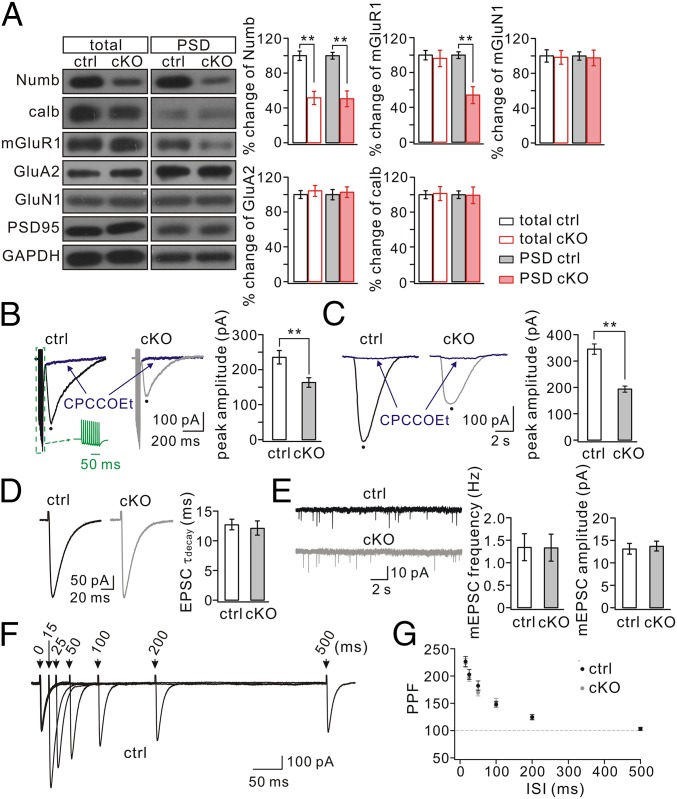
Fig. 3.
Synaptic mGlu1 is reduced in Numb-cKO mice. (A) Cerebellar (total) and PSD fractions from control (ctrl) and Numb-cKO mice were probed with antibodies to Numb, calbindin, mGlu1, GluA2, and GluN1. GAPDH and PSD95 were internal controls for total and PSD, respectively. Histograms show percentage changes of proteins in Numb-cKO mice relative to control. Control (n = 4): 100 ± 5% (total, Numb), 100 ± 4% (PSD, Numb); 100 ± 4% (total, calbindin), 100 ± 4% (PSD, calbindin); 100 ± 5% (total, mGlu1), 100 ± 4% (PSD, mGlu1); 100 ± 4% (total, GluA2), 100 ± 6% (PSD, GluA2); 100 ± 7% (total, GluN1), 100 ± 5% (PSD, GluN1). Numb-cKO (n = 4): 51 ± 7% (total, Numb), 50 ± 9% (PSD, Numb); 101 ± 8% (total, calbindin), 99 ± 9% (PSD, calbindin); 96 ± 9% (total, mGlu1), 54 ± 9% (PSD, mGlu1); 104 ± 6% (total, GluA2), 102 ± 6% (PSD, GluA2); 98 ± 8% (total, GluN1), 97 ± 9% (PSD, GluN1). (B) mGlu1 EPSCs produced by a PF burst (Green Inset: 10 pulses, 100 Hz). mGlu1 EPSCs were blocked by its antagonist CPCCOEt (100 μM). Peaks were measured as indicated by black dots. (C) Slow currents were evoked by a pulse (10 psi, 20 ms) of aCSF containing DHPG (100 μM) and were blocked by the mGlu1 antagonist CPCCOEt (100 μM). (D) Representative AMPA EPSCs in control and Numb-cKO PCs. The decay was fit with a single exponential in both cells, and mean time-constants were 12.8 ± 0.9 ms (control; n = 24) and 12.2 ± 1.2 ms (cKO; n = 30). (E) mEPSCs recorded from control (n = 10) and Numb-cKO (n = 10) PCs. mEPSC parameters were frequency, 1.4 ± 0.3 (control) and 1.3 ± 0.3 (cKO); amplitude, 13.2 ± 1.2 pA (control) and 13.8 ± 1.1 pA (cKO). (F) Superposition of PF EPSCs evoked at different intervals in a control cell. (G) PPF as a function of interstimulus interval in control (n = 11) and Numb-cKO (n = 12) cells. **P < 0.01.

