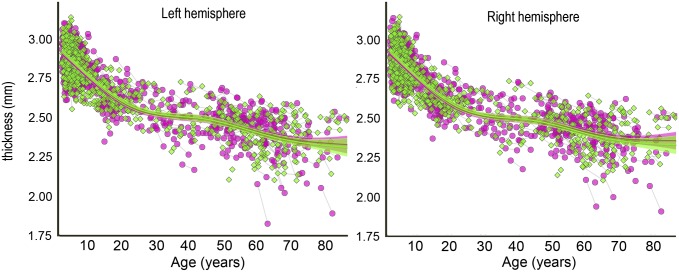
Fig. 1.
Global change in cortical thickness. GAMM was used to estimate the lifespan trajectory of cortical thickness separately for each hemisphere, based on both the cross-sectional and the longitudinal information in the 1,633 observations in the total sample. The shaded area around the fit line represents the 95% CI. Green signifies female and pink signifies male.

