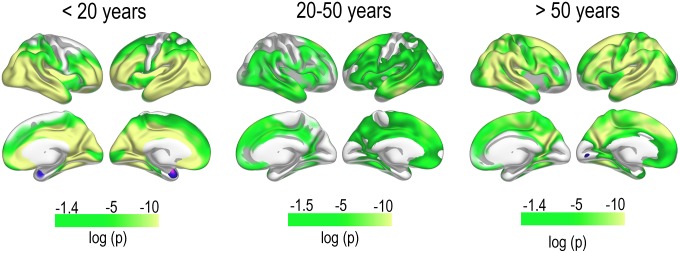
Fig. 2.
Regional change in cortical thickness. Thinning of the cerebral cortex as tested LME using all cross-sectional and longitudinal data. Results are thresholded at false discovery rate <0.05 to control for familywise errors; thus, the left end of the P value scale will vary slightly between age groups and hemispheres.

