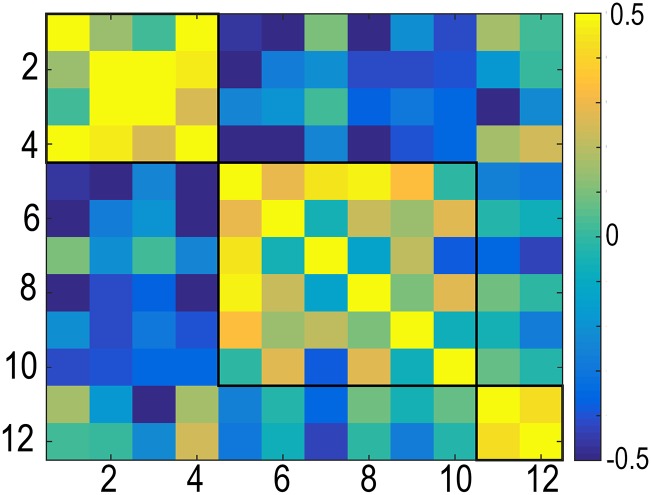
Fig. S3.
Applying the Louvain algorithm to the adult change data. The values are identical to those in the right panel in Fig. 3, but the order of the clusters is 1, 3, 4, 2, 7, 10, 11, 8, 12, 9, 6, and 5. The first and the third group of clusters are identical to two groups found in development and the genetic organization, whereas the remaining two development/genetic organizations are compiled into one big group in aging.

