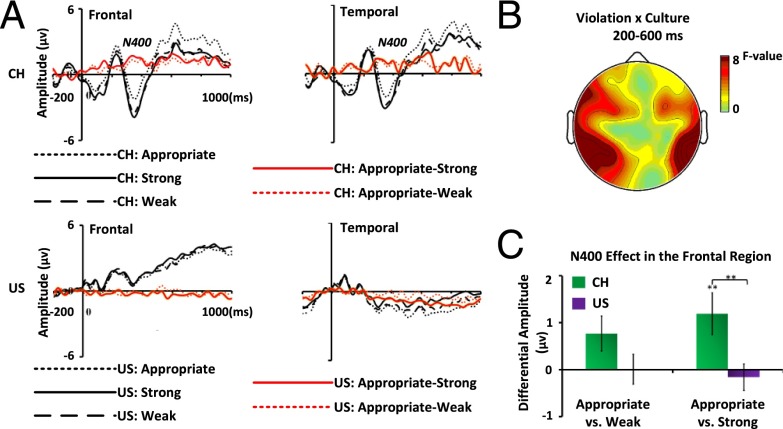
Fig. 3.
Culture-specific N400 effects of social norm violations. (A) Grand average ERPs for the strong, weak, and appropriate conditions and differential ERPs for the contrasts between appropriate and strong/weak condition at the frontal and temporal regions. (B) The F-value topography shows the culture (United States, China) × violation (strong, appropriate) effect at 200–600 ms. (C) The bar chart shows the N400 effect (appropriate vs. strong/weak condition) at 200–600 ms in the frontal region (F4, a representative electrode in the frontal region, was chosen) for Chinese and US groups, respectively.

